

Introduction
Immigration statistics can be overwhelming and even be misused in policy debates affecting the lives and well-being of our immigrant communities. Yet, by having the right resources and knowledge about the data, it can be used to inform, to advocate and to organize for the rights of immigrants and for the support of their communities.
How can we use the statistics for good?
Explore Key Concepts in US Immigration Statistics
Many people find it difficult to work with immigration data because they are not familiar with some of the terms or statistics that are used by analysts. The following are several key elements that must be understood in order to properly analyze the many sources of immigration data.
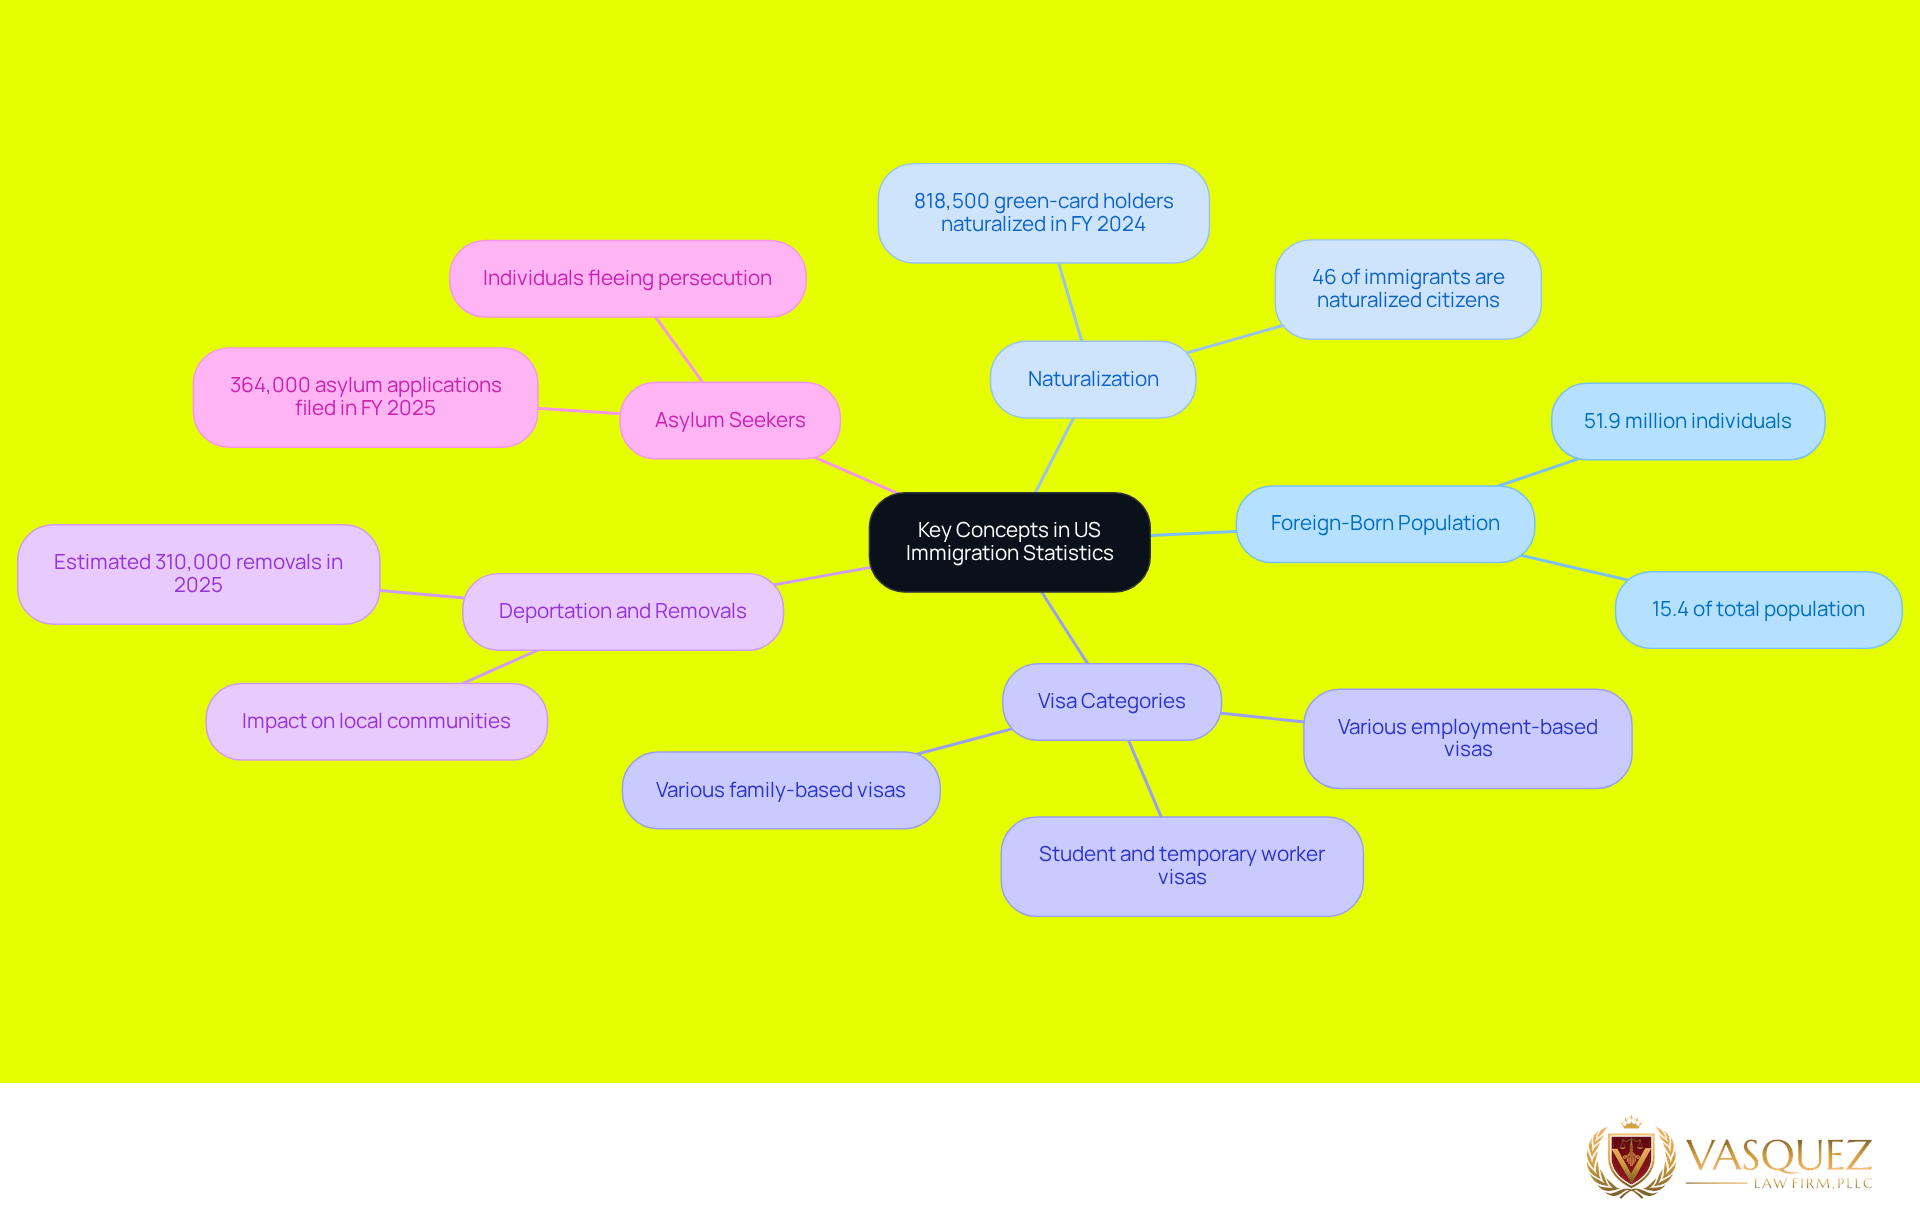
- Foreign-Born Population: Estimated 51.9 million foreign-born individuals residing in U.S. as of 2026. In comparison to the overall population of the U.S., 51.9 million or 15.4% of total population are foreign-born workers and their families. These individuals bring their culture and their skill sets to a local community as well as to the overall workforce.
- Naturalization: Naturalization is the process where foreign citizens can become naturalized U.S. citizens. In FY 2024, 818,500 green-card holders in the U.S. became naturalized citizens. This group of people are true Americans who have gone through the trouble of acquiring a second passport and going through the naturalization process to become part of the largest and greatest country in the world, the U.S.A.
- Visa Categories: The analysis of the U.S. immigration graph requires knowledge of the many different classifications of immigrant and non-immigrant visas that permit foreign nationals to enter the U.S. for temporary or permanent residence. These would include the various different types of family-based visas and the various different types of employment-based visas. Also included would be the various different types of visa for students, temporary workers, and other purposes. Removing the many different categories of immigration visas from the U.S. immigration graph would result in a much clearer picture and allow for more accurate analysis of the current trends in immigration to the U.S.
- Deportation and Removals: Statistics of deportations of immigrants provide information about enforcement of residency laws as well as the impact of the laws on local communities. In 2025 it is estimated that about 310,000 individuals worldwide will be removed from the U.S. and return to their countries of origin.
- Asylum Seekers: This can include individuals fleeing persecution and even death. Numbers of individuals seeking asylum can help illustrate large amounts of individuals trying to make their way to the U.S. in order to avoid various kinds of persecution. According to available statistics for the FY 2025 cycle, there were roughly 364,000 asylum applications filed by people all over the world.
Furthermore, it is also very important to be aware of the immigration data in each state. For example, states like North Carolina and Florida have a very high number of foreign-born individuals residing in these states and working in various industries. If someone is in a legal emergency and receives a subpoena or is the subject of an ICE enforcement action, he or she should seek legal assistance immediately. Vasquez Law Firm is equipped to assist clients in these types of situations as well as others. Our attorneys also have a community education project in which we teach “Know Your Rights” in both English and Spanish. Our goal with this project is to educate the community on the various rights that individuals have. In addition to the community education project that we have, Vasquez Law Firm also offers scholarships for first generation college students that are pursuing a career in law in order to bring more diversity to the practice of law and to assist students that need financial assistance to pay for college. And, lastly, having knowledge of the terms and statistics that are used to analyze the information regarding the immigration and how it affects the people in this country can be very helpful in being better informed in a situation where one needs support in a difficult time.
Analyze Types of Data in Immigration Graphs
The amount of information that exists can be too much for one to handle, especially when it comes to something that is very complex and touches on so many different emotions and viewpoints as immigration does. This complex issue is often graphed in a simple US immigration graph. As with any topic of importance, if one were to assist their family or community in going through the processes of immigration, it would be good to learn how to find information, and use the information that is found in a thorough manner in order to provide the best assistance possible to those in need.
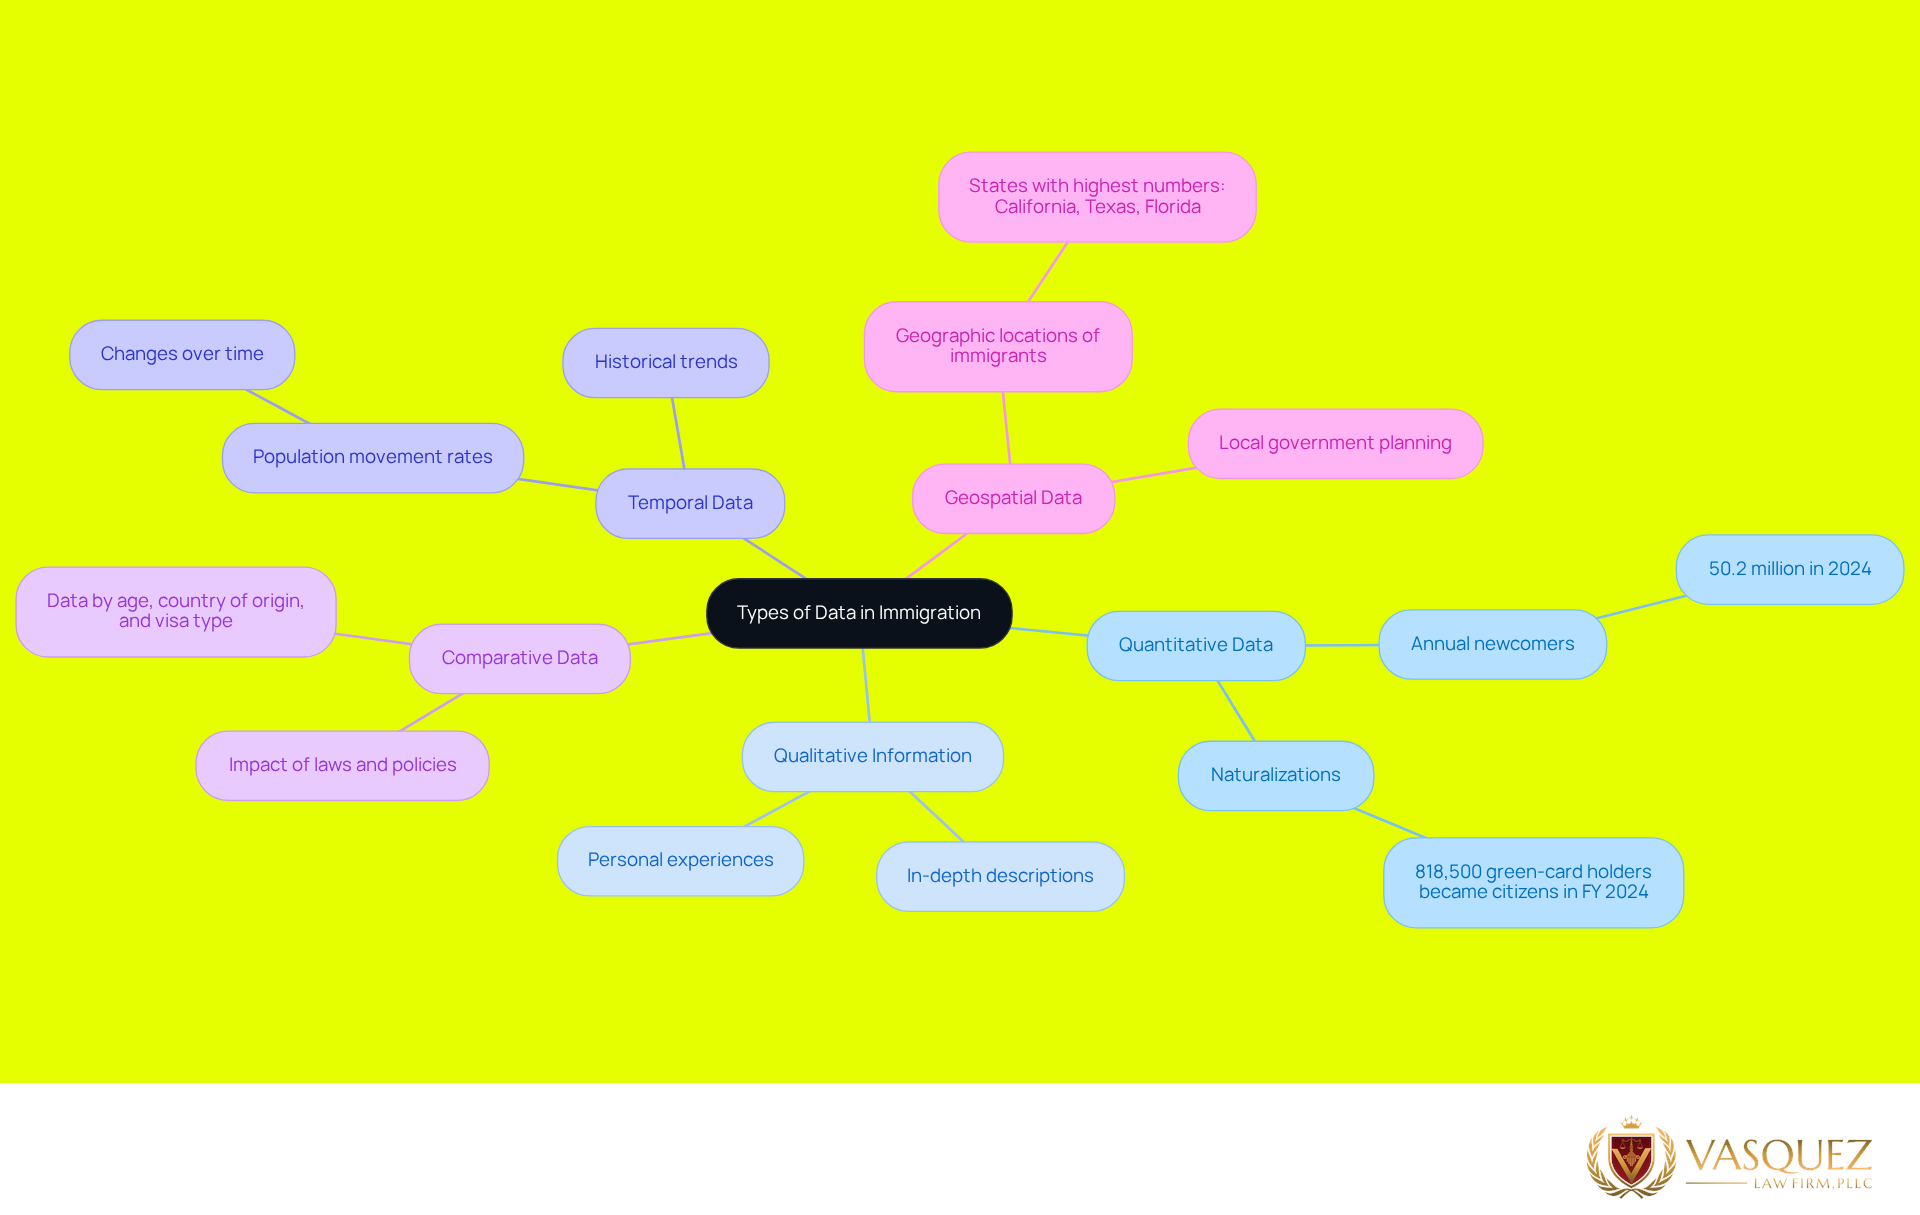
- Quantitative Data (or numerical data): This type of information can be analyzed with statistics, although one must first gather and organize the information. For example, the graph shown above presents US immigration data in the form of a simple graph for the annual number of newcomers to the US today, which today is over 50.2 million people in 2024.
- Qualitative Information: This information provides a description and/or story of events of individuals or groups. Many people can provide great insight by relating their own experiences or by providing in-depth descriptions of others. In addition, qualitative information can give further clarification to those who are trying to interpret quantitative information.
- Temporal Data: For graphs that depict immigration population statistics, the time frame over which the statistics were gathered could be an important aspect of the graph. This would show the user the changes in population movement rates over time for certain demographics. These rates could be falling indicating a negative change or they could be increasing for the community being studied indicating a very positive change.
- Comparative Data: Many groups of data can be sorted and viewed by different criteria such as by age, country of origin, and type of visa that an immigrant used to enter the country. By looking at these groups of data it can be determined what are the different statistical measures and trends and what negative and positive effects they have on immigrants and on the countries to which they immigrate. For example, 818,500 green-card holders became naturalized U.S. citizens in FY 2024. This is affected by the laws and policies regarding citizenship that exist in the U.S. today.
- Geospatial Data: Information about the geographic location of people who enter the country, those who reside here, and new residents of states and local communities. Information about the residents of new immigrants can help support local governments planning for these people and meeting their needs. For example, the states with the highest numbers of new arrivals in 2024 are California, Texas, and Florida. These same states had the largest absolute increases in number of new arrivals between 2010 and 2024.
Learning to help your family or community with information that is available already to assist, even if you have all of it, can be a challenging task. For people with even average amounts of ability to understand through data (statistics) to use that information to aid their relatives and community graphing the US immigration, in detail and comprehensively, is crucial to enable them to tackle the immigration process.
Apply Techniques to Interpret Immigration Graphs
The vast majority of people cannot read graphs and charts, and it is no different when trying to gather information about your own immigration status. But, by following this list of steps for how to read charts and graphs with data about your immigration status, you will be well on your way to using such graphics to make very informed decisions regarding your own future.
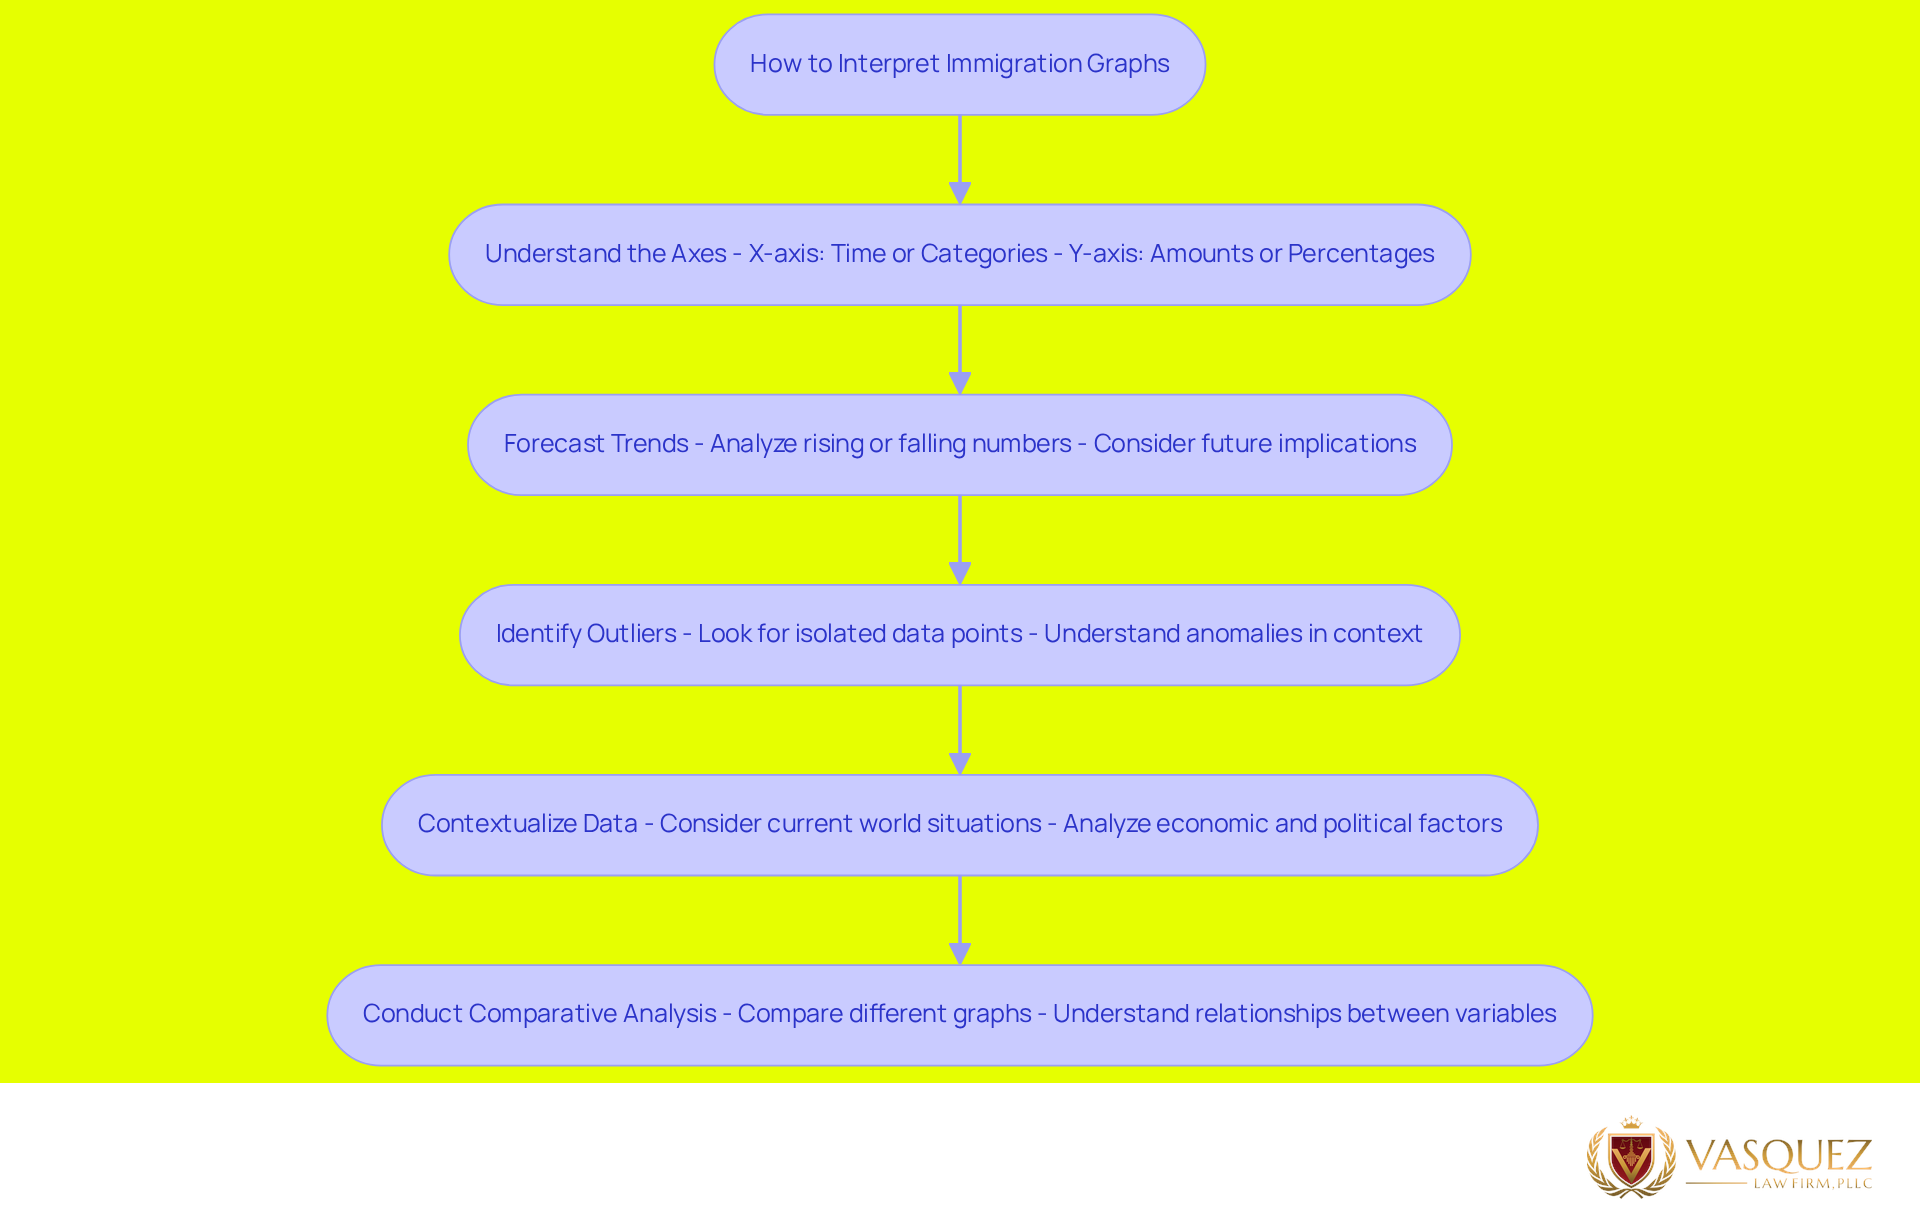
- The 2 Axes on a Graph: The x-axis (on the bottom) in graphs are usually either time (in years) or categories (countries for example) and give important information to understand trends of immigration for individuals and their families. The y-axis (on the side) shows numbers of amounts (of people, of dollars for example) as percentages in most cases.
- Forecasting: Numbers can be rising or falling. This is important when thinking about your status and how future trends of population growth through migration might affect the statistics of the U.S. population. Forecasts for the amount of net international migration (NIM) for the year 2026 are expected to decline and actually fall below the current statistics to 321,000.
- Find the Outliers: If your study includes graphs that present information in graphical form then it is most likely that there will be areas on the graph where there is data that is separated from the rest of the information. These isolated areas of data will typically contain important information. For example in studying the flow of immigration into the U.S. an isolated area of data could be caused by an anomaly in the data that was brought on by a change in an immigration law or by an increase in the number of deportation agents.
- Contextualize the Data: When analyzing statistics about the movement of the population, it is also important to take into account the current world situation. For example, economic downturn, or political strife in a given country. Looking at the decline of 567,000 Mexican migrants from 2010 to 2024 for example can help give insight into current trends of population movement and how they are changing.
- Comparative Analysis: Comparing graphs and/or data, it is possible to find both similarities as well as differences in them. For example, by studying two graphs: the statistics on the population growth through migration and the statistics of the unemployment rate, it would be possible to understand the immigration’s impact on the economy as well as the relationship between the two mentioned variables. In addition, more than a quarter of the children under 18 years old in the U.S. have at least one immigrant U.S. parent; by knowing the statistics on immigration to the U.S. it would be possible to project its implications for the rest of the U.S. population statistics in the future.
Information obtained from graphs about immigration will help you make informed decisions regarding your future.
Understand the Impact of Immigration Data on Policy and Community
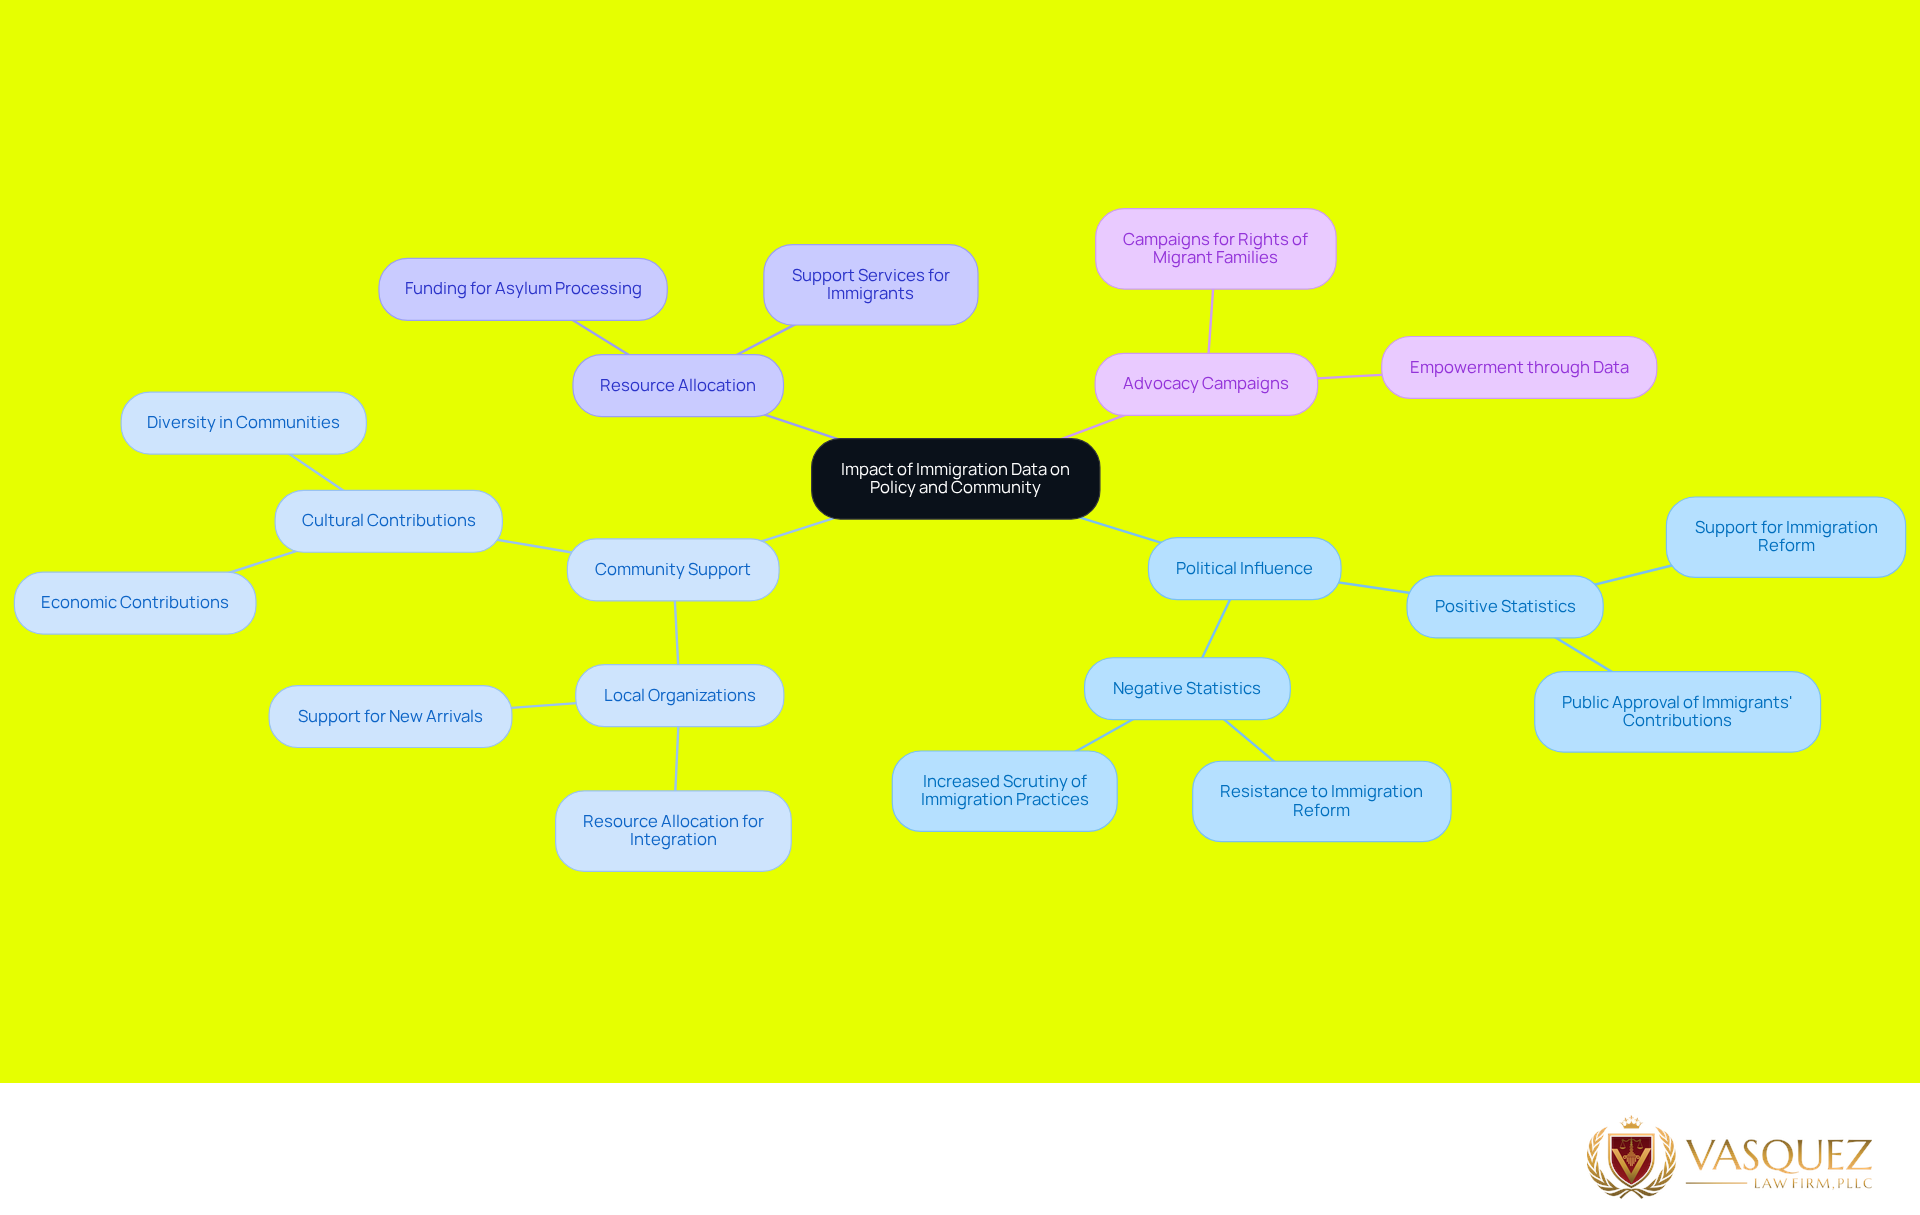
This new data on the statistics of the US immigration will be very useful for politicians when talking about the stats of immigrants living in the US as well as the other trends and stats that are currently happening in our country and how they affect the people who are seeking asylum in the US and how the asylum policy is and how the funds are being allocated to process the many applications of asylum seekers.
In the case of statistics that are perceived to be largely positive towards immigrants and their contributions to society, these same statistics can be very powerful in garnering support for reform in immigration laws. Conversely, however, mostly negative statistics will often serve to fuel resistance to change in immigration laws as well as an increased scrutiny of the current practices in place for immigration in the US.
The statistics provided by this US immigration graph can also be beneficial to local communities and organizations as well as businesses. The stats help local organizations by allowing them to figure out where to focus their resources, in order to best serve their new communities, and help them integrate into the community as well. Local organizations and businesses can really help foster a community where all people can live and thrive in peace. This is especially true for places where a lot of new people are arriving and settling in.
The graph of statistics from the US immigration chart, for example, shows that there are many cultures of individuals who come to the country to create a good, strong, and diverse community. Their contributions to the economic and social aspects of society show us that there are many good qualities in the cultures of individuals of Hispanic origin that can be used to fight against the general perception of negative stereotypes that many individuals have of this community of individuals of different cultures.
Information or data is powerful in a campaign advocating for the rights of a migrant community. Such information or statistics can be used to make a strong and effective campaign.
At Vasquez Law Firm, over 100 years of immigration experience is translated into effective and personalized representation of immigrant families. Our Hispanic speaking immigration lawyers are here to serve the needs of the Hispanic community. Our office offers our clients the unique opportunity of speaking with a qualified immigration lawyer in English or Spanish, as well as free initial consultations, and payment plans to afford our clients the opportunity to seek out immigration legal services. We hope these valuable statistics and information will also serve to empower and inform the rights of migrant families and connect them with valuable resources needed to face immigration challenges.
Conclusion
We look at important immigration data in order to better understand how US immigration policy works and to empower others to defend their rights as well as the rights of their loved ones and their community who are going through the process of US immigration in order to live and work in the US.
Immigrant foreign-born residents in the United States are an integral part of our growing nation. A closer look into foreign-born naturalized U.S. citizens and their processes, a list of foreign visas for foreign U.S. working residents, a look at foreign-born deportees of U.S. working residents in the U.S., and an overall look at how quantitative data and qualitative data can be utilized by statistics for informing public perception regarding foreign-born residents and the policies that pertain to them. Through this article and an understanding of foreign-born data, foreign-born residents of the U.S. can acquire knowledge of all the processes they go through and be able to support foreign-born U.S. working residents through the stages of the processes to aid them in their attempts to become full citizens of the U.S. and the rights that foreign-born residents are entitled to.
There are few people who are able to make sense of the information that is released regarding the foreign-born population in the U.S. The same holds true for information that is released by federal, state, and local government agencies who report on data regarding immigration and foreign-born residents. For those who have foreign-born family members and friends who are going through the same process to become a full U.S. citizen, knowing how to read data regarding foreign-born U.S. residents can be very powerful. Not only can such data provide invaluable information for families and for communities of foreign-born workers, such information can help to inform other foreign-born workers as to the processes that must be completed in order to become a naturalized U.S. citizen. By analyzing such information, foreign-born residents can be empowered in order to combat misconceptions that exist in regards to foreign-born residents. By becoming more informed, foreign-born residents are also be able to find the best resources that are available in their local communities in order to gain the best help for themselves and their families. Such is the case with the Vasquez Law Firm where bilingual staff is available to serve clients.
Frequently Asked Questions
What is the estimated foreign-born population in the U.S. as of 2026?
The estimated foreign-born population in the U.S. is 51.9 million, which represents 15.4% of the total U.S. population.
What does naturalization mean in the context of U.S. immigration?
Naturalization is the process through which foreign citizens can become naturalized U.S. citizens. In FY 2024, approximately 818,500 green-card holders became naturalized citizens.
What are visa categories in U.S. immigration?
Visa categories refer to the various classifications of immigrant and non-immigrant visas that allow foreign nationals to enter the U.S. for temporary or permanent residence, including family-based visas, employment-based visas, student visas, and temporary worker visas.
What are the statistics regarding deportation and removals in the U.S.?
It is estimated that about 310,000 individuals will be removed from the U.S. and returned to their countries of origin in 2025.
What are asylum seekers and how many applications were filed in FY 2025?
Asylum seekers are individuals fleeing persecution or threats to their safety. In FY 2025, approximately 364,000 asylum applications were filed by people worldwide.
Why is it important to understand immigration data in specific states like North Carolina and Florida?
Understanding immigration data in states like North Carolina and Florida is important because these states have a high number of foreign-born individuals who contribute to various industries. This knowledge can help in addressing legal emergencies and understanding community dynamics.
What services does Vasquez Law Firm offer for individuals facing legal emergencies related to immigration?
Vasquez Law Firm provides legal assistance for individuals facing legal emergencies, such as receiving a subpoena or being subject to ICE enforcement actions.
What community initiatives does Vasquez Law Firm participate in?
Vasquez Law Firm has a community education project that teaches 'Know Your Rights' in both English and Spanish, and offers scholarships for first-generation college students pursuing a career in law to promote diversity in the legal field.
List of Sources
- Explore Key Concepts in US Immigration Statistics
- What the data says about immigrants in the U.S. (https://pewresearch.org/short-reads/2025/08/21/key-findings-about-us-immigrants)
- New Population Estimates Show Historic Decline in Net International Migration (https://census.gov/newsroom/blogs/random-samplings/2026/01/historic-decline-in-net-international-migration.html)
- Naturalization Statistics | USCIS (https://uscis.gov/citizenship-resource-center/naturalization-statistics)
- Macroeconomic implications of immigration flows in 2025 and 2026: January 2026 update | Brookings (https://brookings.edu/articles/macroeconomic-implications-of-immigration-flows-in-2025-and-2026-january-2026-update)
- Frequently Requested Statistics on Immigrants and Immigration in the United States (https://migrationpolicy.org/article/frequently-requested-statistics-immigrants-and-immigration-united-states)
- Analyze Types of Data in Immigration Graphs
- Frequently Requested Statistics on Immigrants and Immigration in the United States (https://migrationpolicy.org/article/frequently-requested-statistics-immigrants-and-immigration-united-states)
- New data show intensifying unauthorized immigration decline, with large local variations (https://dallasfed.org/research/economics/2026/0113)
- What the data says about immigrants in the U.S. (https://pewresearch.org/short-reads/2025/08/21/key-findings-about-us-immigrants)
- New Population Estimates Show Historic Decline in Net International Migration (https://census.gov/newsroom/blogs/random-samplings/2026/01/historic-decline-in-net-international-migration.html)
- US Immigration and Border Security Fact Sheet: State of the Union 2026 | USAFacts (https://usafacts.org/reports/state-of-the-union/immigration)
- Apply Techniques to Interpret Immigration Graphs
- Policy Backgrounder: The Outlook for Immigration Policy (https://conference-board.org/research/policy-backgrounders/the-outlook-for-immigration-policy)
- New Population Estimates Show Historic Decline in Net International Migration (https://census.gov/newsroom/blogs/random-samplings/2026/01/historic-decline-in-net-international-migration.html)
- MPI’s Guide to Key U.S. Immigration Statistics Offers One-Stop-Shop to Understand Changing Trends (https://migrationpolicy.org/news/frequently-requested-us-immigration-statistics-2026)
- This Week by the {Immigration} Numbers (June 13, 2026) (https://austinkocher.substack.com/p/this-week-by-the-immigration-numbers-e69)
- Monthly immigration update: April 2026 | George W. Bush Presidential Center (https://bushcenter.org/publications/monthly-immigration-update-april-2026)
- Understand the Impact of Immigration Data on Policy and Community
- Immigration drops shift population, political power to Texas and Florida • Stateline (https://stateline.org/2026/01/27/immigration-drops-shift-population-political-power-to-texas-and-florida)
- Surge in U.S. Concern About Immigration Has Abated (https://news.gallup.com/poll/692522/surge-concern-immigration-abated.aspx)
- Immigration to Become the Sole Driver of U.S. Population Growth (https://osbm.nc.gov/blog/2026/03/12/immigration-become-sole-driver-us-population-growth)
- Immigration in 2026: What the Data Reveal about American Attitudes | NORC at the University of Chicago (https://norc.org/research/library/immigration-2026-what-data-reveal-american-attitudes.html)
- Policy Backgrounder: The Outlook for Immigration Policy (https://conference-board.org/research/policy-backgrounders/the-outlook-for-immigration-policy)


